1. Introduction to Spatial Transcriptomics
Dario Righelli
Department of Statistical Sciences, University of Padova, Padua, Italydario.righelli@unipd.it Source:
vignettes/Vig01_Introduction.Rmd
Vig01_Introduction.RmdIntroduction
Spatial organization of cells in tissues are well known to be particularly relevant to understand their functions, which in turn are influenced by transcripts expression and epigenomics factor. To unveil this relation, in the last years, multiple technologies are emerging to allow to extract this information. We refer to these technologies with Spatially Resolved Technologies, but during this workshop we’ll focus on Spatial Transcriptomics Technologies.
Spatial Transcriptomics Technologies
With Spatial Transcriptomics (ST) we refer to all those technologies able to joint detect transcripts quantification with their spatial coordinates into the understudy tissue.
At the moment, we distinguish two main families of ST, molecular-based and spot-based technologies.
Molecular-Based family
The main idea of these technologies is to detect the transcripts locations in a tissue in multiple temporal snapshots at cellular and sub-cellular level.
Examples of this family are: seqFISH(+), MERFISH, others.
Main differences within this family are due to the way of transcripts coordinates are detected and the number of detected transcripts.
The seqFISH(+)
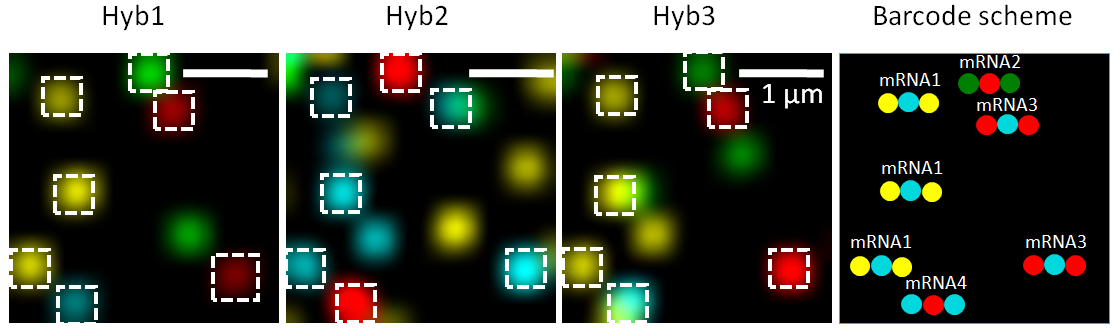
seqFISH technology (Lubeck et al. 2014) uses temporal barcodes of transcripts multiple hybridization rounds in combination with image microscopy and FISH approach.
This allows detecting the localization of the transcripts at each barcoded time.
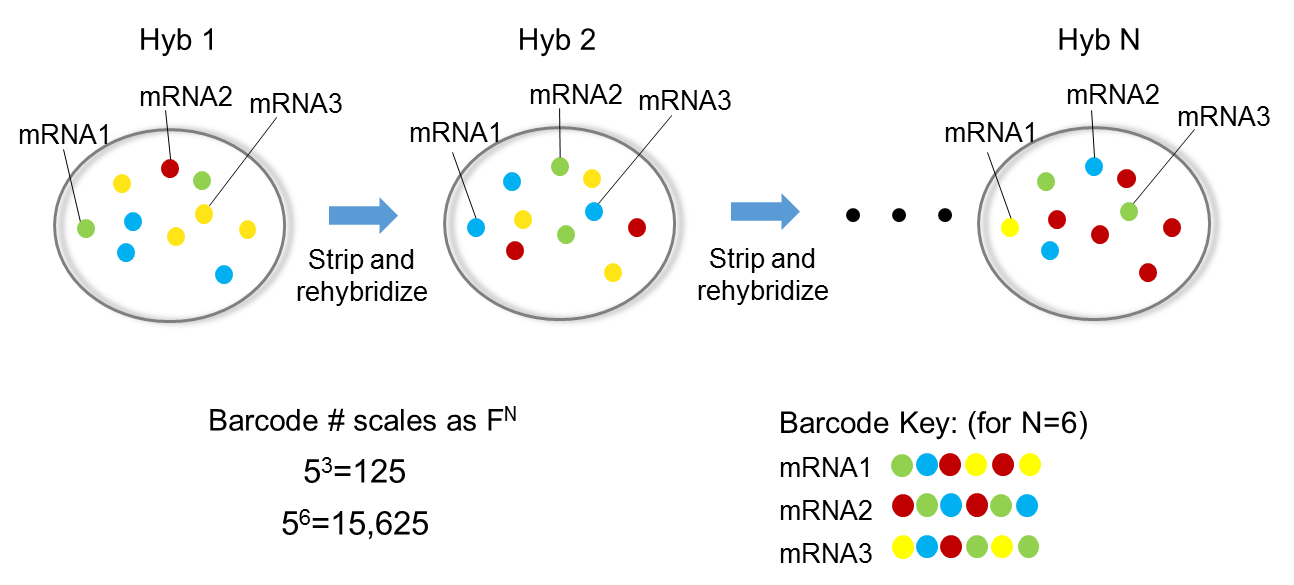
For each Barcode we have multiple hybridization rounds to co-localize transcripts.
N.B. No cDNA or PCR amplification is needed with this technology.
This process can be directly applied on a tissue slice.
The first version (seqFISH) of this technology allowed to detect lower number of transcripts, while the second version (seqFISH+) (Eng et al. 2019) allows detecting thousands of transcripts at each round which allows this technology to be comparable to a whole transcriptome one.
Spot-Based technologies
The main idea of this technology is to provide uniquely identified (i.e. barcoded) reference spots with associated coordinates and transcripts abundance. The number of cells in the spot depends on the spot size.
Technology examples of this family are: 10x Visium Spatial Gene Expression, Slide-seq(V2).
Main differences within this family are due to spots size and the spots reference protocol.
The 10x Genomics Visium Spatial Gene Expression
This technology uses ad-hoc designed barcode-spots based chips where tissue slices can be placed on.
The number of spots is pre-defined, so we already know how many spots are on the rows and columns of the chip.
Here is an example of a Mouse Brain tissue slice placed on a 10x Visium chip.

While we take a snapshot in full resolution of the on-chip placed tissue slice, the unique barcoded-spots do cDNA amplification of the transcripts.
In such a way, at the end, we have an image reference of the experiment and a whole transcriptome amplification per each spot.
(Details about the experiment output will be given during the second part of this workshop by Helena and an example dataset will be provided during the third part by Lukas.)
The SpatialExperiment class
To facilitate the implementation of methodologies and spatial data handling in R, we designed a new class named SpatialExperiment. This class inherits from the popular Bioconductor class SingleCellExperiment and extends it with specific slots and get/set methods for spatial data.
Here is a schematics of the organization of the actual (devel version) SpatialExperiment class.

The class is organized around the assays data structure (more details in part 2):
Attributes:
- assays: contains the primary and/or transformed data (such as counts matrix)
- rowData: information about the assays rows*
- colData: information about the assays columns* and spatial coordinates
- reducedDims: dimention reductions representations (such as PCA/tSNE/UMAP)
- imgData: samples related images.
SpatialExperiment proper Methods:
- spatialCoords: returns/sets the spatial coordinates in a matrix form
- spatialData: returns the spatial metadata
- imgData: gets/sets the imgData
- loadImg, unloadImg, addImg, removeImg: imgData handling methods
- spatialCoordsNames: returns the name of stored spatial coordinates
- spatialDataNames: returns the spatialData colnames
- molecules: dedicated assay for molecule-based data, based on BumpyMatrix class
The SpatialExperiment class for this workshop is the official Bioconductor devel version of it.
To simplify your analysis today, you can use the Docker image simply by running:
docker run -e PASSWORD=<SET_A_PASSWORD> -p 8787:8787 drighelli/spatialexperiment_bioc2021Once docker command finished download and installation, navigate to https://localhost:8787/ and then login with rstudio:
In short
We provided the main overview of Spatial Transcriptomics technologies, focusing on seqFISH for the molecule-based family and on 10x Genomics Visium Spatial Expression for the spot-based ones.
We set up a class for spatial data analysis at single-cell/spot level providing ad-hoc attributes and specifically designed methods for attributes managing.
This latest version of the class is still under development even it’s already usable.
Extra Resources
If you’re interested in a multimodal seqFISH dataset you can retrieve it from the SingleCellMultiModal Bioconductor package.
It is a multimodal dataset providing data for seqFISH and scRNAseq data, these data can be combined for multimodal single-cell data integration methods developments, testing and/or analysis.
More details about an investigation of this dataset can be found at this link.
Or you can run:
if (!requireNamespace("BiocManager", quietly = TRUE))
    install.packages("BiocManager")
BiocManager::install("SingleCellMultiModal")

library("SingleCellMultiModal")
vignette("seqFISH", package="SingleCellMultiModal")
References
(seqFISH) Lubeck, E., Coskun, A., Zhiyentayev, T. et al. Single-cell in situ RNA profiling by sequential hybridization. Nat Methods 11, 360–361 (2014). https://doi.org/10.1038/nmeth.2892
(seqFISH+) Eng, CH.L., Lawson, M., Zhu, Q. et al. Transcriptome-scale super-resolved imaging in tissues by RNA seqFISH+. Nature 568, 235–239 (2019). https://doi.org/10.1038/s41586-019-1049-y
(MERFISH) Chen, Kok Hao, et al. “Spatially resolved, highly multiplexed RNA profiling in single cells.” Science 348.6233 (2015).
(Slide-seqV2) Stickels, Robert R., et al. “Sensitive spatial genome wide expression profiling at cellular resolution.” bioRxiv (2020).
seqFISH reference website: https://www.seqfish.com/technology
10x Genomics Visium Spatial Gene Expression website https://www.10xgenomics.com/products/spatial-gene-expression